A script for qPCR analysis in R

An R script for those who like to be close to their qPCR data and catch problems early. It takes export files (multicomponent data, text format, “across columns”) of Life Technologies StepOne machines.

A standard analysis can be done in less than 5 minutes. It consists of these steps:
– plotting of the raw signal (and saving of the result) to catch odd amplification and strong offsets
– baseline correction
– magnified plotting (and save) to check correction and drift in signal
– cycle estimation by using a threshold
– tabulation of the results

Continue reading

If Nature had done the maths properly …

A Nature report about a new, enzymatic assay of Mycobacterium tuberculosis is (inadvertently) mostly a stark reminder that the false positive and the false negative rates are both important for evaluating an assay’s performance. Superficially, no doubt the assay has advantages: it does not require PCR, prolonged bacterial culture or microscopy, and delivers a result in half an hour unlike current standard methods. It is also sensitive: in a test it flagged all samples positive which microscopy found. Microscopy missed 50% of all positive samples, but even of those missed by microscopy the new method flagged 80% positive. Overall the assay recognises 90% of the Tb+ cases as such.

Despite of these advantages this is not yet a promising method. There is a 27 % false positive rate, i. e. the assay flags a quarter of all tested patients as Tb positive even though there are no Tb-causing bacteria in their samples. This is a problem because only 2-400 / 100 000 people get tuberculosis in any country of the world (World Bank). The new test flags about 27 000 positive out of those 99 600 healthy persons in the population. Continue reading

Poetry in programming: a Quine, suitable for birthdays

A program that emits its own python source code when run, i.e. a Quine.

a="a= ;print a[0:2]+chr(34)+a+chr(34)+a[3:]#Another happy return!";print a[0:2]+chr(34)+a+chr(34)+a[3:]#Another happy return!

A version in particular for biologists with added emphasis on the cycle of life:

a="a= ;print a[0:2]+chr(34)+a+chr(34)+a[3:]#Keep studying the miracle of life!";print a[0:2]+chr(34)+a+chr(34)+a[3:]#Keep studying the miracle of life!


Old microscope + £100 (+ 3D printer) = GFP fluorescent microscope

[News: Someone linked this text from the Open Source Toolkit: Hardware article collection and channel of PLoS. Thanks.]

I built my first fluorescent microscope. A Leitz Labovert became a surprisingly decent fluorescent microscope for DIY after spending about £100 and 3D printing a few custom parts. It is a simplified design with only a barrier and an excitation filter, LED illumination and no dichroic mirror.

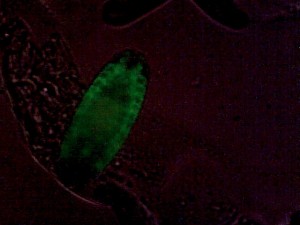
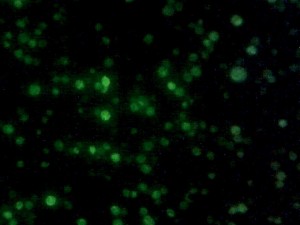
The quality is sufficient for observing fluorescent yeast and in general fairly faint Drosophila embryos in low-to-midrange magnification.

Drosophila embryonic tracheal system, GFP-marked. Weak additional bright-field illumination for embryo outline.

Drosophila embryonic tracheal system, GFP-marked. Weak additional bright-field illumination for embryo outline.

Yeast with nuclear GFP marker.

Yeast with nuclear GFP marker.

Fluorescence is short wavelength light in, longer wavelength light out. In principle a fluorescent microscope needs only two parts: 1) a light source that emits light at the excitation, but not at the emission wavelengths of the sample, and 2) a barrier filter, which lets only the emitted longer wavelength light through, so it doesn’t drown out in the excitation light. There are a few details though, and I will start with the barrier filter.

Continue reading

Setting the lower cutoff of a miniprep

It maybe a less known fact that the lower cutoff of PCR cleanup and other DNA minipreps may be dialed in by appropriately diluting the binding buffer with water. PCR cleanup kits usually don’t bind fragments below 50-100 bp, depending on the manufacturer. Using water, dilution of the chaotropic salts in the binding buffer sets this limit higher. DNA smaller than the new limit runs through the coloumn, while higher MW DNA adsorbs as before. This can sometimes save the effort of gel purification. Continue reading

Javascript date calculation

A little contribution to make the Genetics Department fly facility media ordering system more user friendly. This snippet calculates the earliest possible delivery date to be used as default delivery time. The challenge was of course writing it without a single comparison or [if] clause. It ran for a while until Sysadmin Ian decided that he wanted one with more functionality.

var asap = new Date(new Date().getTime()+129600000);
asap.setTime(asap.getTime()+86400000*((asap.getDay()+1)%5)*(Math.exp(0, (asap.getDay()%6))));

(Tomorrow, if it is before 12 o’clock, otherwise the day after tomorrow, but either only if that day is not a day of the weekend. In that case the Monday after.)

Squiggle: visualise cave surveys in 3D

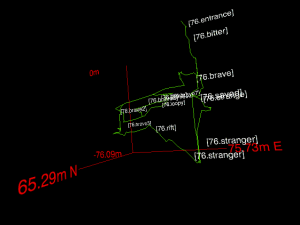
I wrote Squiggle, a little set of scripts that produces animated 3D views of cave surveys natively in web browsers. Squiggle is based on the javascript library three.js.

squiggleCheck out this small survey or this cave system (this one might crash browsers on older machines). The controls are as usual: drag for rotating, scroll for zoom. The surveys were made by the Cambridge University Caving Club (CUCC)‘s Austria expeditions, and over time, Squiggle will be used to preview them. Thanks to Wookey for his help in making and testing Squiggle.

Let me know if you would like to use Squiggle to visualise your data.

A complete mitochondrial chromosome in Drosophila chrU

The latest Drosophila melanogaster 5 genome has a complete copy of the mitochondrial chromosome embedded in chrU, which makes it a trap for mitochondrial RNAseq reads. If the aligner randomly distributes reads between all matching sites, half of the mitochondrial reads will go to chrU. All reads will be lost if ambiguous alignments are discarded.

chrU_mito

Peak: mitochondrial reads aligned to chrU. (UCSC genome browser)

ChrU is not a real chromosome, but a 10 Mb mixed bag of 34,630 small scaffolds, that didn’t seem to fit anywhere during shotgun genome assembly. My best guess is, that the 19.5 kb mitochondrial scaffold seemed far too small to be anything real during genome assembly, so the Celera shotgun assembler just lumped it into chrU with all the other loose fragments. According to this paper, the fragment is the true y1, cn1, bw1, sp1 strain mitochondrial genome, in contrast to the reference chrM, which is a composite of several genomes.

Leaving out all, or parts of chrU during alignment is an obvious solution. The coordinates of the mitochondrial bit are (roughly) chrU:5288508-5303826, and turning this stretch into N’s preserves the remainder of chrU, without trapping mitochondrial reads. Another option is to leave out chrU altogether. This is probably justifiable given that most of chrU are just duplicated fragments from other parts of the genome, only sequenced in much worse quality and thus not fitting into their original place.

[Update] I heard BDGP will remove this snag in the release 6 genome.


Guides for Barplots

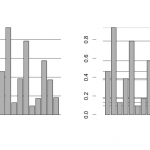
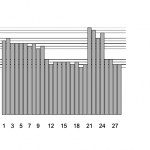
Regular lines in the background of barplots are useful, but  they are never where they need to be. Then the guessing begins: how far is that bar from the guide?

In the comparisons below the regular lines look more Zen peaceful, but the lines at bar levels are much more useful in comparing bar heights. In the first graphs the guides show that some bars with similar heights are not quite equal, and in the second graph it becomes immediately apparent, that there are three distinct groups of values.

This little R snippet does the job:

prettybarplot <- function(yvalues, labels=NULL){
 barplot(height=yvalues, names.arg=labels, axes=FALSE)
 abline(h=yvalues)
 barplot(height=yvalues, names.arg=labels, add=TRUE, axes=FALSE)
 axis(side=2, col="white", col.ticks="black", line = 1, xpd=TRUE )
}