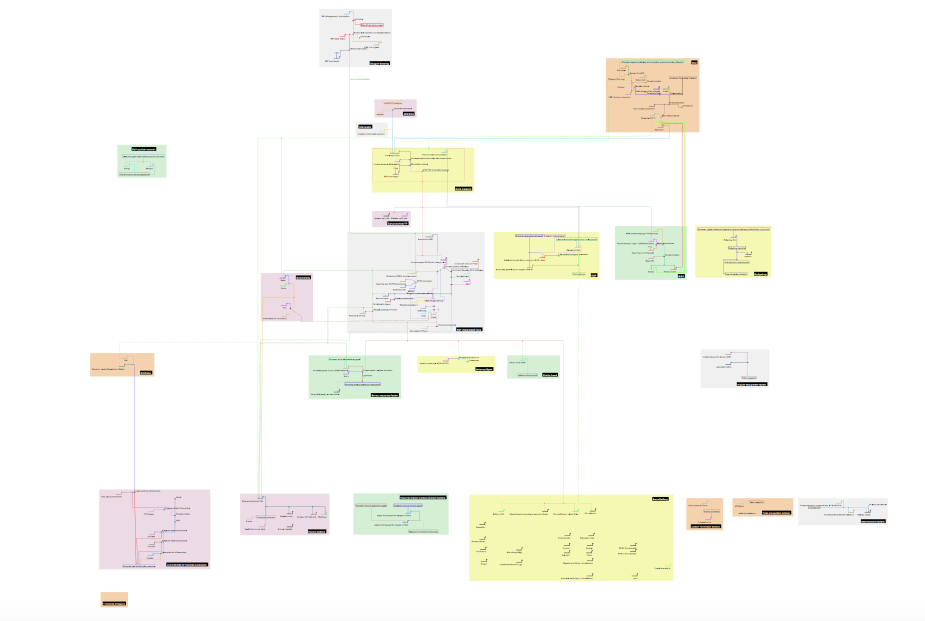
Gene regulatory network of trachea formation, distilled from all relevant reviews up to 2011. The fully sized zoomable network is here.
For the first year progress report of my PhD project I was asked to summarise the genetics of tracheal tube formation in the fruit fly embryo (trachea are the insect equivalent of lungs). Tubes are one of the favourite building blocks of animal development, and are used ubiquitously. Though not always obvious, tube formation is the first step in forming the digestive tract, the branches of the trachea in the lung, kidney nephrons, blood vessels, various glands, and feathers. Tracheal development in fly embryos is a prime example of branched tubule formation. In short, cells decide that they are going to be trachea, and organise themselves into a single-layered hollow tube. Branches form as groups of cells follow various chemical signals, and break away from the main mass of cells.
Struggling with putting a highly complex and interwoven process into words, I eventually realised that a graphical representation would be more adequate. After all, we don’t use long descriptions such as “Here is a large building X, in street Y. Next to it is building Z, opposite is lengthy square A, and on the left side of it is round building B…” It would be very hard to use, compared to a map. We have also long stopped expressing mathematical relationships through prose, instead using diagrams, and a highly compact notation. Similarly, the causality relationships in electronic circuit designs are either expressed through formalised diagrams, or, the inherent logic is expressed in a formalised (and executable!) hardware description language.
It seems genetic networks are the last very complex systems where the prevailing opinion is that they are best expressed in beautiful and creative prose. There are several problems with this: Continue reading
![David Molnar [Update:, PhD]](https://www.srcf.ucam.org/~dm516/wp-content/themes/twentyeleven/images/headers/chessboard.jpg)