![David Molnar [Update:, PhD]](https://www.srcf.ucam.org/~dm516/wp-content/themes/twentyeleven/images/headers/chessboard.jpg)
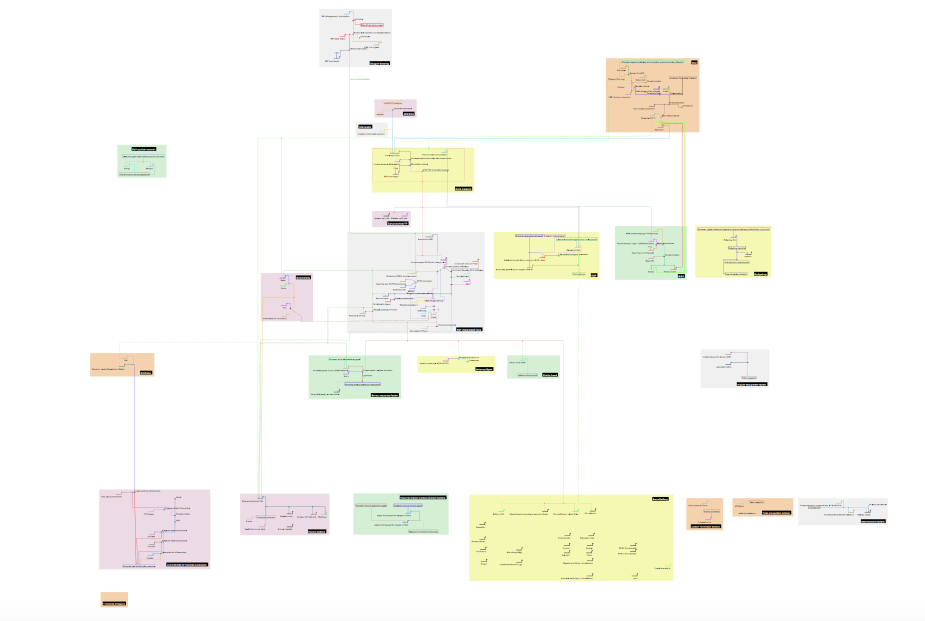
Gene regulatory network of trachea formation, distilled from all relevant reviews up to 2011. The fully sized zoomable network is here.
For the first year progress report of my PhD project I was asked to summarise the genetics of tracheal tube formation in the fruit fly embryo (trachea are the insect equivalent of lungs). Tubes are one of the favourite building blocks of animal development, and are used ubiquitously. Though not always obvious, tube formation is the first step in forming the digestive tract, the branches of the trachea in the lung, kidney nephrons, blood vessels, various glands, and feathers. Tracheal development in fly embryos is a prime example of branched tubule formation. In short, cells decide that they are going to be trachea, and organise themselves into a single-layered hollow tube. Branches form as groups of cells follow various chemical signals, and break away from the main mass of cells.
Struggling with putting a highly complex and interwoven process into words, I eventually realised that a graphical representation would be more adequate. After all, we don’t use long descriptions such as “Here is a large building X, in street Y. Next to it is building Z, opposite is lengthy square A, and on the left side of it is round building B…” It would be very hard to use, compared to a map. We have also long stopped expressing mathematical relationships through prose, instead using diagrams, and a highly compact notation. Similarly, the causality relationships in electronic circuit designs are either expressed through formalised diagrams, or, the inherent logic is expressed in a formalised (and executable!) hardware description language.
It seems genetic networks are the last very complex systems where the prevailing opinion is that they are best expressed in beautiful and creative prose. There are several problems with this:
- Everyone has to find new words to describe the same process again and again.
- It is impossible to put the whole complexity into text of non-excessive length and thus each description includes and omits arbitrary subsets of the whole.
- It is very difficult to describe feedback loops compactly, and multiple influences, because every combination of effects has to be spelled out, so again, most are omitted.
- It takes huge amounts of reading around to get a full view of a system that is in the end less complex than a slightly sophisticated alarm clock.
- The textual representation and the difficulty to collate all information obscure gaps and holes in our understanding.
- It is very hard to form new hypotheses and avoid missing of existing knowledge of important processes.
- Many signalling and control mechanisms are extensively used in different biological contexts, but collecting knowledge from other contexts is even harder.
- If anyone wants to have a full view and a comprehensive understanding of control at any point, he will have to take paper and pencil, and draw a diagram of the descriptions anyways.
At the Gene Regulatory Networks in Development summer school of Eric Davidson in Woods Hole I came across the Biotapestry system of visualisations. It is aiming to standardise diagrams of gene regulatory network causality similarly to electronic circuit designs. The symbol of genes is the bold arrow with a neck and a head. In the back of this symbol arrive thinner arrows from other genes, and the head symbolises activation or repression.
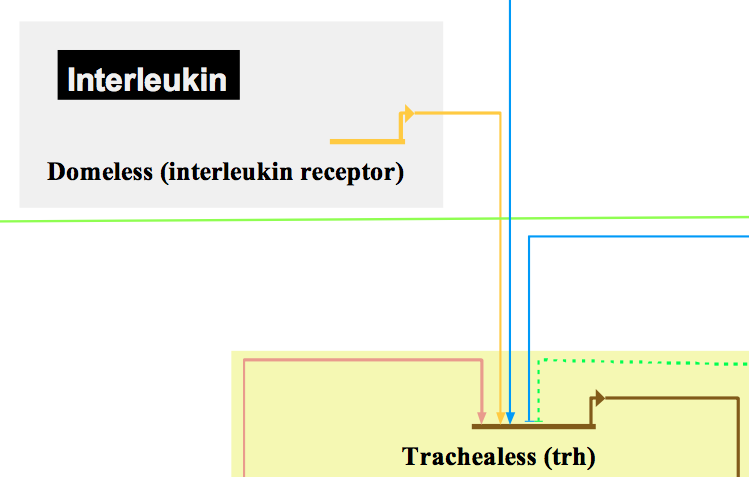
Gene representation in Biotapestry. Domeless activates Trachealess transcription together with other activators. The blue blunt arrow represents the activity of a transcriptional repressor.
The advantage is that with increasing knowledge, more information may be worked into the same diagram. In the beginning a process may be represented by a generic square: e.g. “Notch signalling” activities something. As the transcriptional and post-transcriptional processes are teased apart, more and more details and actors can easily be introduced.
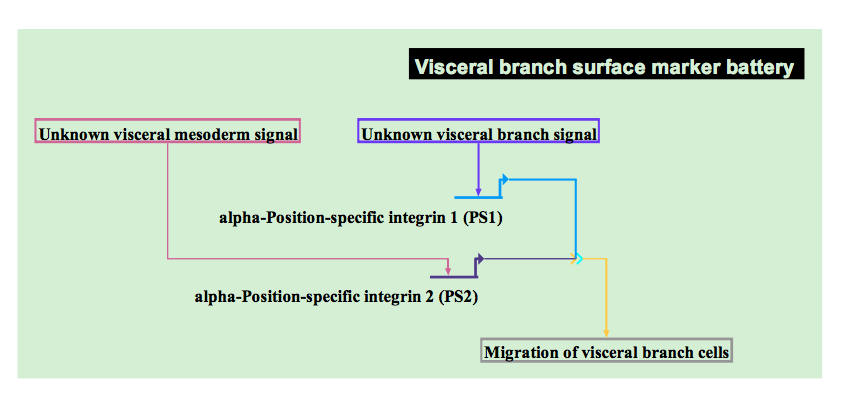
Generic placeholders for unknown mechanisms.
An invaluable advantage of Biotapestry is that it acknowledges that each cell in an animal shares the same genome. Therefore, if the actors of a particular regulatory process are expressed in cells A, and cells B, then they must behave the same way. If not, there must be a further actor D, that causes the difference. This breaks through the walls of silos in which researchers of different cellular systems find themselves, and lets them automatically profit from each other’s work. It also shines a bright light on inconsistencies and gaps in models.
I extended this language with further symbols, so that post-translational processes can be represented, too. To represent the stream of matter that is transformed from one form of molecule to an other I use the analogy of water streaming in pipes. From the gene symbol coming the thin arrow is a pipe of protein. If this protein is modified to obtain a different form, there is a branch off, and the flow is split according to the activity of the conversion.
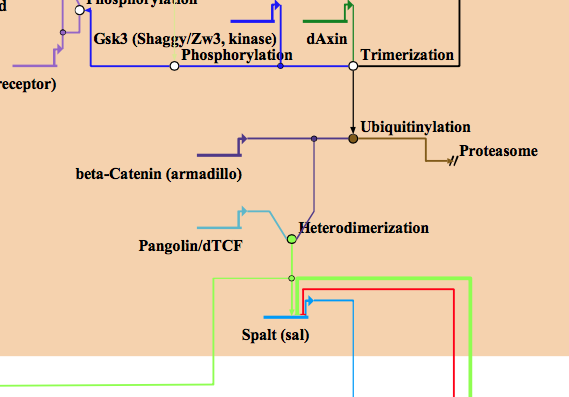
Posttranslational modifications galore.
Sometimes this conversion rate is modifiable, in analogy to a tap (or transistor). Feedback loops form if one of the products is the modifier. If one path is shut off, more matter finds itself in the alternative path. In the end, in a complete diagram all paths should, after a series of conversions, end in the proteasome where proteins are degraded and their parts recycled. A tap on the ubiquitination step enabling degradation can steer material flows upstream as well. Quite intricate and capable systems can build this way. I am not sure whether all have been realised by those who have described them in prose.
I collated the information from all published reviews of Drosophila tracheal development, and some primary research, which is a sizeable pile. Nonetheless, all information is contained in a handy poster-sized diagram that can be taken in a relatively short time, and is a very quick reference. It also only took about a week to do. I annotated all links and genes with references to literature, which in the Biotapestry viewer are accessible with a click (this does not work with the online viewer). I certainly learned a lot about this developmental process, and the many gaps, holes and loose ends of the diagram showed me even more what we don’t know.
The full model is here. You will need to zoom in.
(A disadvantage of Biotapestry has been that it requires a rather heavy java app for visualisation. I therefore converted the output to SVG and have begin work on some java script to allow panning and zooming. A fully autonomous web viewer, which uses XSL transformations (XSLT) to natively show Biotapestry XML files as SVG has not quite advanced to prime time.)
For those interested, here is some background, although not quite a full explanation of the model:
There are various mechanisms of tube formation, and flies use three of them: 1) cells forming a compact rod, stick together on sides only, and then become prism-shaped, so that a lumen opens up in the middle. 2) cells becoming hollow inside, and thus a single cell becomes the wall of the tube, and 3) cells wrapping themselves around, and close up a tube (the difference to 2) is that there is a seam).
Trachea form from groups of cells in the side walls of the fly embryo. The cells take positional cues from chemical gradients within the embryo, and agree within a sharply delineated patch (or placode) of ectoderm, that they all will become trachea. Then they begin to reshape and move themselves that a mould forms, which invaginates ever further. The group of cells extends as a solid mass into the lumen of the embryo. A number of cells at the tips is then elected through (chemical) acclamation as aptly named tip cells. The solid mass grows fingers, as each tip cell begins to follow a different chemical trail, while dragging a procession of cells behind. Each of the fingers will fuse with the corresponding finger of a neighbouring placode to form a continuous tube from the beginning to the end of the animal.
Later, after the main branches have formed, became hollow, and second-order branches have formed, the rigid program of development ends. Around the time when the embryo hatches as a larva and begins to move around (only 24 h after the begin of development!) a demand-based program begins. Thin, third order branches begin to grow to where there is a lack of oxygen, following chemical signals from suffocating cells.
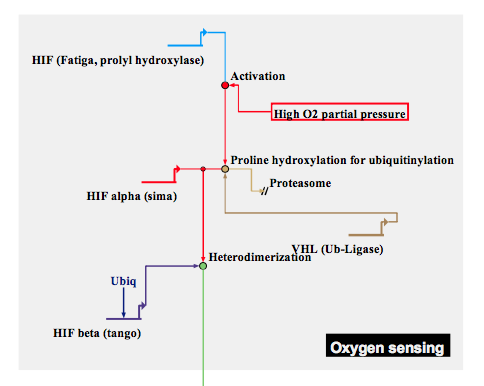
Sensing of low oxygen in somatic cells activates signal that arrests tracheal branches. Fatiga is activated through plentiful oxygen, and causes the degradation of Sima. If oxygen is in low supply, Sima accumulates and begins to form heterodimers with ubiquitously expressed Tango, ultimately activating FGF signalling to attract tracheal cells that deliver air to the oxygen-starved cell.