Image feature detectors are a common concept between mammalian vision and computer vision. When using them, a raster image is not directly processed to identify complex objects (e.g. a flower, or the digit 2). Instead feature detectors map the distribution of simple figures (such as straight edges) within the image. Higher layers of the neural network then use these maps for distinguishing objects.
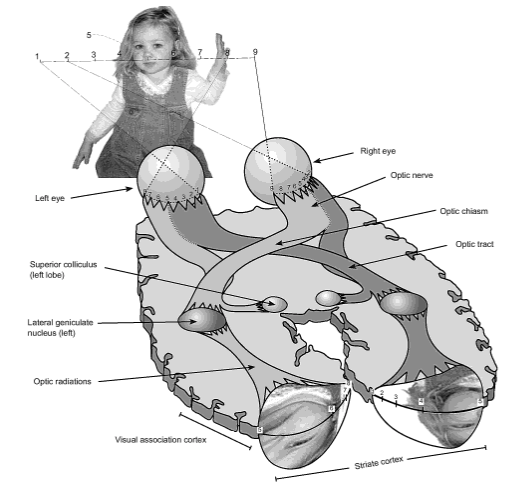
In the mammalian brain’s visual cortex (which is at the back of the head, at the furthest possible point from the eyes) the image on the retina is recreated as a spatially faithful projection of the excitation pattern on the retina. Overlapping sets of feature detectors use this as input.

From eyeball to visual cortex in humans. Note the Ray-Ban-shaped area at the back of the brain where the retinal excitation pattern is projected to with some distortions. (From Frisby: Seeing: the computational approach to biological vision (2010), p 5)
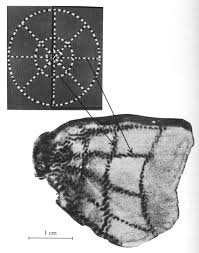
How we know about retinotopic projection to the visual cortex: an autoradiography of a macaque brain slice shows in dark the neurons that were most active in result of the animal seeing the image on top left. (From Tootell et al., Science (1982) 218, 902-904.)
A feature detector neuron becomes active when its favourite pattern shows up in the projected visual field – or more exactly in the area within the visual field where each detector is looking. A typical class of detectors is specific for edges with a specific angle, where one side is dark, and the other side is light. Other neurons recognise more complex patterns, and some also require motion for activation. These detectors together cover the entire visual field, and their excitation pattern is the input to higher layers of processing. We learned about these neurons first by sticking microelectrodes into the visual cortex and measuring electrical activity. When lucky, the electrode measured the activity of a single neuron; then by showing different visual stimuli the activation pattern of the neuron could be mapped.
Continue reading →
![David Molnar [Update:, PhD]](https://www.srcf.ucam.org/~dm516/wp-content/themes/twentyeleven/images/headers/chessboard.jpg)